 Directions
Resources
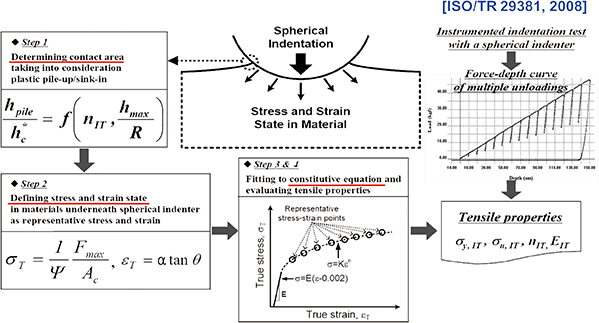
Tensile Characteristics – Representative Stress - Strain Method
In an indentation test, the strain and strain rates near the indentation site vary depending on the location. However, once the material reaches full plastic deformation, average stress and strain values can be estimated within the plastic region. Experimental results show that the flow stress is maximum at the specimen surface and the edge of the spherical indenter, which is related to the average pressure (pm). This result indicates that the strain in the plastic region depends on the ratio of the contact radius (a) to the indenter radius (R). The relationship leads to the following equations:
 Representative Stress : σr=pm/ψ
Representative Strain: εr : εr= f(a/R)
Where σr and εr represent the representative stress and strain caused by the indentation, and ψ is the plastic constraint coefficient derived from the stress field under the spherical indenter.
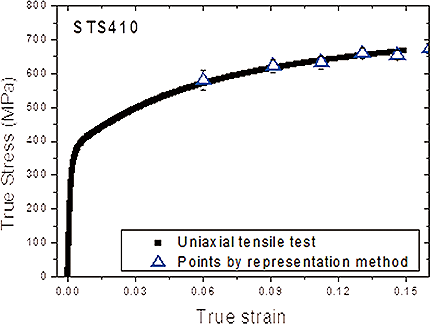
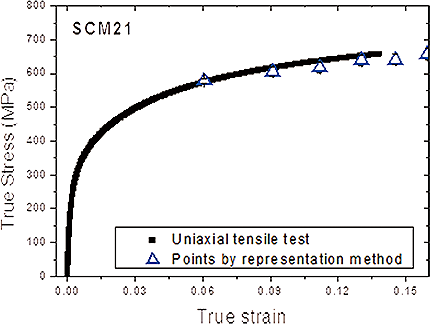
By measuring the average pressure (pm) at each indentation depth, a pm–a/R curve can be obtained. The contact radius (a) can be determined from the contact depth (hc) using the formula a = √(2Rhc - hc). This value can then be converted into the representative stress-strain form to obtain a σr–εr curve, as shown in Figure 1.
#1401, Ace Techno Tower 10th, 196, Gasan Digital 1-ro, Geumcheon-gu, Seoul, Republic of Korea
Phone: +82-2-884-8025 Fax: +82-2-875-8018 General Inquiries: info@frontics.com Sales and Overseas Distributor Inquiries: sales@frontics.com


