 Directions
Resources
Technology
Resources
Fracture Toughness (KJC)
Fracture toughness is an indicator of a material's resistance to crack propagation under applied external forces, representing the energy expended near the crack tip.
. To evaluate fracture toughness (KJC) using theInstrumented Indentation Test (IIT), the energy absorbed during fracture testing is linked to the accumulated deformation energy at a critical indentation depth corresponding to a specific fracture initiation point. This allows for the quantification of fracture energy through indentation testing, which simulates a stress state similar to that at the crack tip.
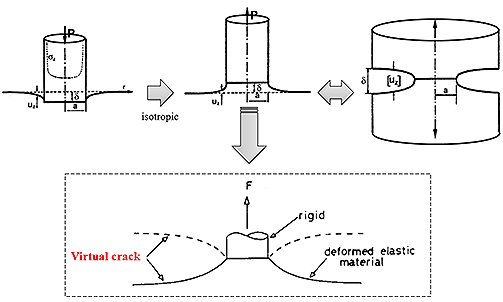
In fracture testing, when an external load is applied near a crack, high stress and deformation concentrate at the crack tip. Similarly, in IIT, a flat punch indenter is used to create a triaxial stress state at the surface, inducing significant plastic constraint. The stress concentration at the edge of the indenter closely resembles the stress concentration at the crack tip in conventional fracture test specimens (CRB), as shown in Figure 1.
Figure 1. Comparison of Stress States in Flat Punch Indentation and CRB Specimens
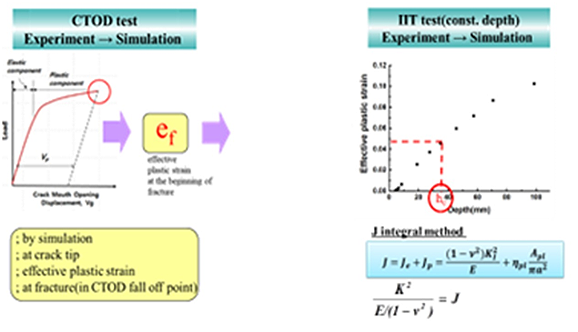
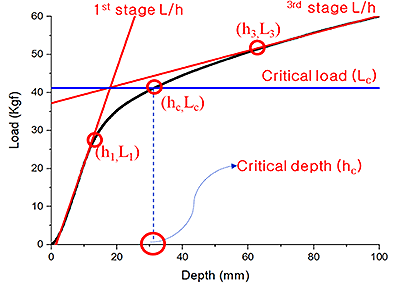
In crack tip opening displacement (CTOD) tests, fracture initiation is based on the point at which crack propagation begins. In IIT, the critical indentation depth is determined as the depth at which fracture strain is reached. This depth is related to the major transition point in the flat punch indentation load-depth curve (see Figure 2).
Figure 2. Determination of Critical Indentation Depth Using Fracture Effective Strain
The flat punch indentation curve is generally divided into three distinct regions: elastic, plastic, and linear deformation. The fracture mode, whether ductile or brittle, is determined by the shape of the indentation curve, and the Relative Transformation Factor (RTF) can be used to classify the fracture mode. An RTF below 0.2 indicates abrittle fracture, while an RTF above 0.2 indicatesa ductile fracture.
Figure 3. Key Regions and Transition Points in the Flat Punch Indentation Curve
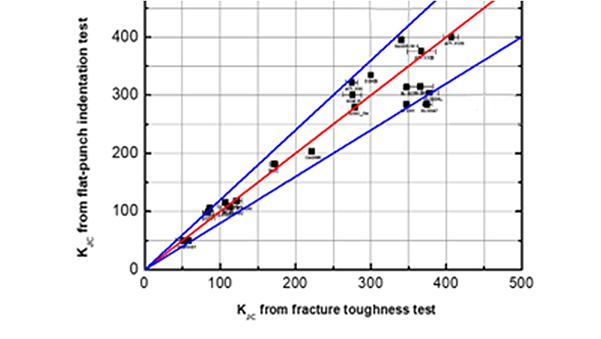
Fracture toughness is calculated from the area up to the critical point of the flat punch indentation curve. Experimental comparisons show that IIT measurements align with experimental results within a 20% margin for metallic materials. This indicates that the accumulated deformation energy up to the critical indentation depth is closely related to the energy required for fracture, demonstrating that IIT can provide accurate fracture toughness evaluations (see Figures 4 and 5).
Figure 4. Comparison of Plastic Regions in CRB and Flat Punch Indentation Specimens
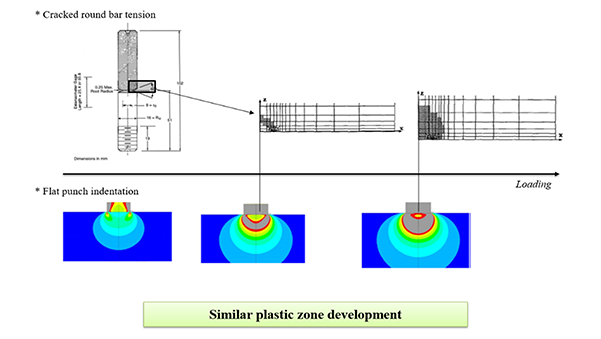
Figure 5. Comparison of Fracture Toughness between IIT Measurements and Experimental Results
#1401, Ace Techno Tower 10th, 196, Gasan Digital 1-ro, Geumcheon-gu, Seoul, Republic of Korea
Phone: +82-2-884-8025 Fax: +82-2-875-8018 General Inquiries: info@frontics.com Sales and Overseas Distributor Inquiries: sales@frontics.com
Copyright (C) FRONTICS. All rights reserved.
Designed by website.co.kr


